
Scrape GitHub Repository Contributors and Commit Activity with Python
GitHub already exposes a lot of public data, but not every workflow needs API auth, rate-limit math, or extra schema work.
If you just want a quick engineering-health snapshot for a repository, the public site gives you enough to collect:
- contributor activity
- weekly commit totals
- recent commit cadence
- repo metadata you can join later
In this tutorial we will scrape a repository's public contributors and commit activity views, export a clean dataset, and keep the network layer production-friendly.
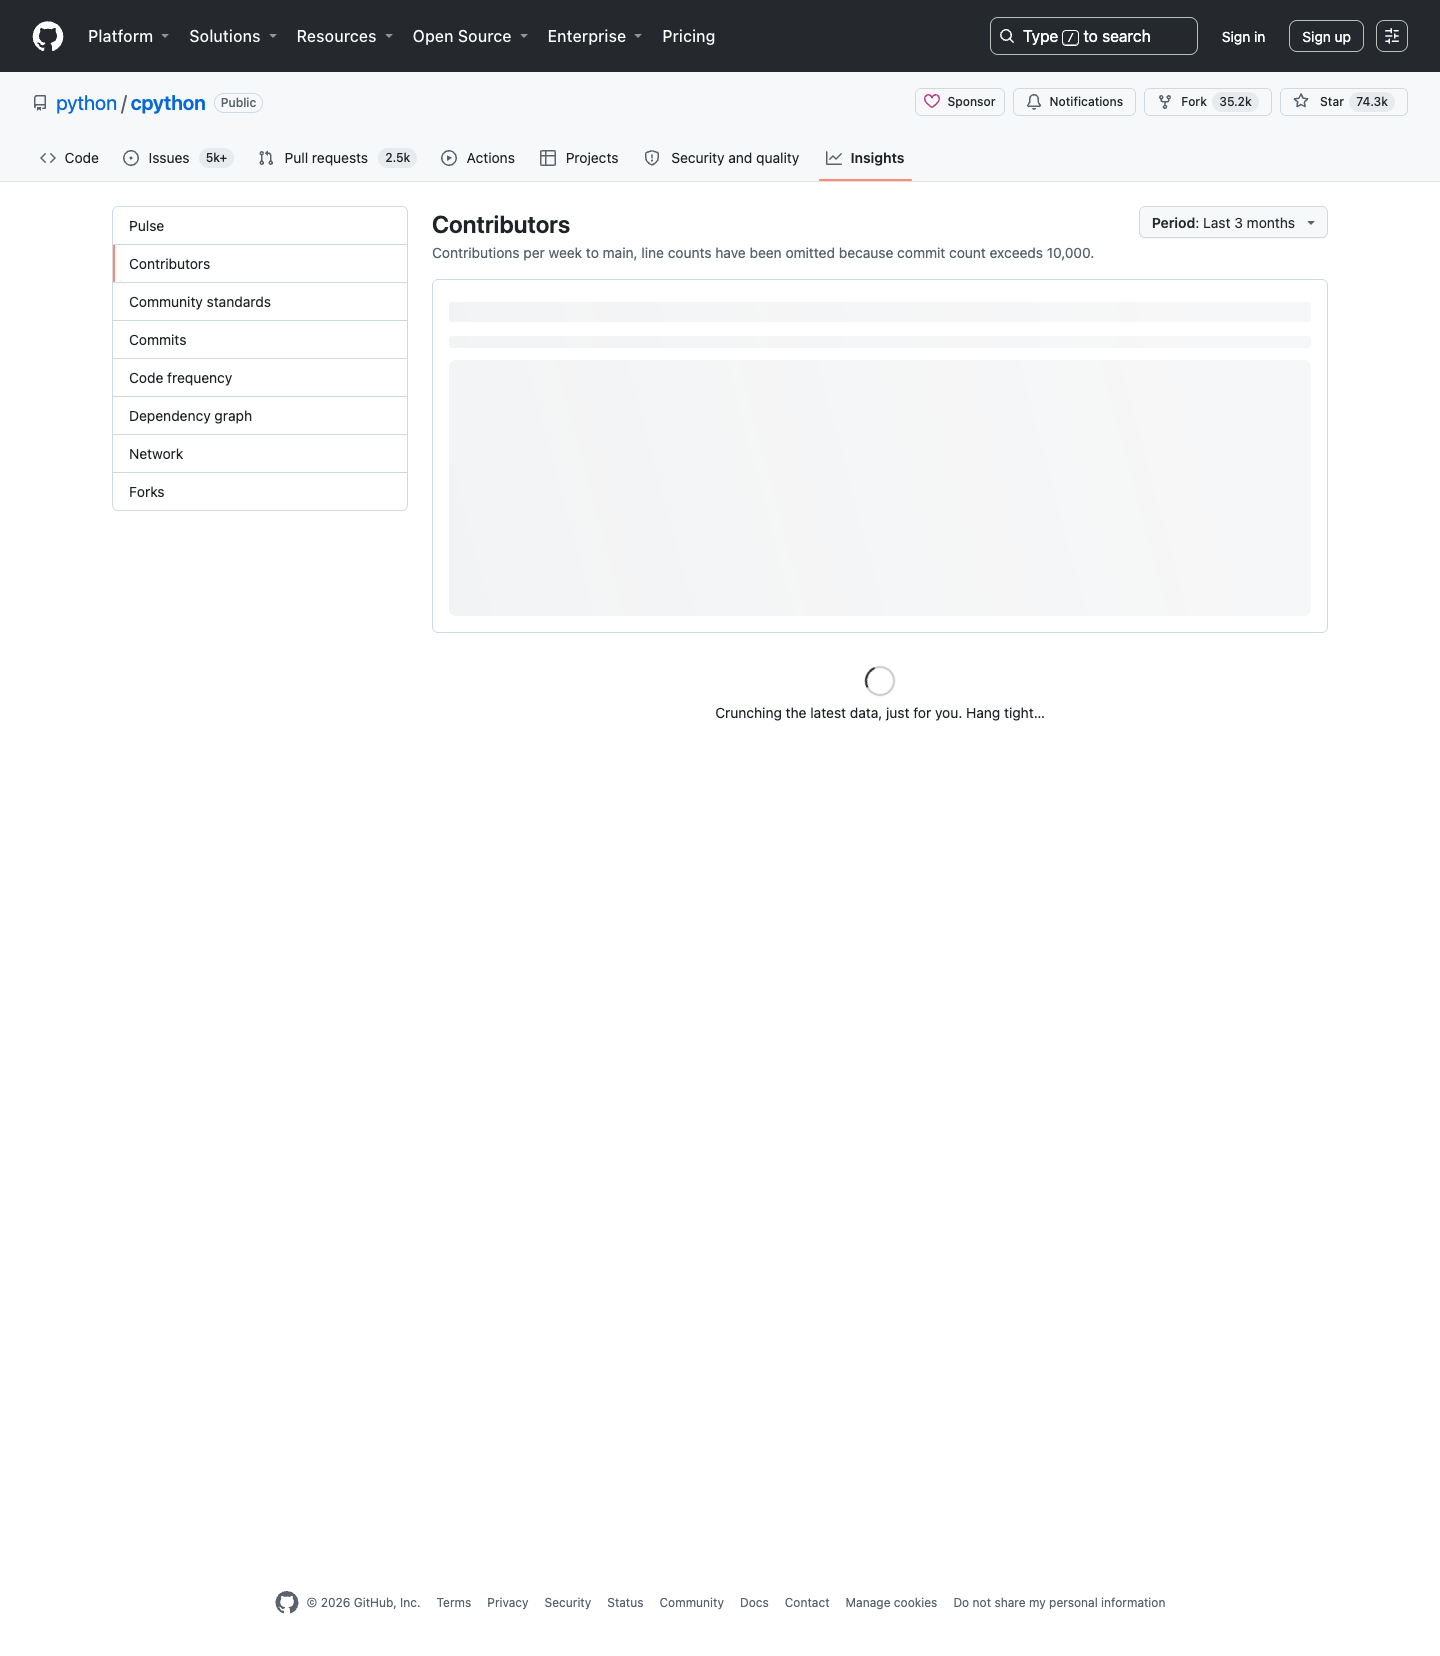
Public GitHub pages are easy to test manually, but scheduled scraping across many repositories benefits from retries, pacing, and a proxy layer you can switch on without rewriting the scraper.
What we are scraping
For a public repository, GitHub exposes:
- repo page:
https://github.com/{owner}/{repo} - contributors graph page:
https://github.com/{owner}/{repo}/graphs/contributors - commit activity graph page:
https://github.com/{owner}/{repo}/graphs/commit-activity
The key detail is that the contributors page includes embedded JSON telling the frontend where to load the graph data:
<script type="application/json" data-target="react-app.embeddedData">
  {"payload":{"graphDataPath":"/python/cpython/graphs/contributors-data"}}
</script>
And the commit activity data is available from a JSON endpoint:
https://github.com/{owner}/{repo}/graphs/commit-activity-data
That gives us a practical split:
- use HTML parsing to discover the graph data path
- use GitHub's public JSON graph endpoints for the actual time-series data
Setup
python3 -m venv .venv
source .venv/bin/activate
pip install requests beautifulsoup4 lxml pandas
Step 1: Build a fetch layer with retries
from __future__ import annotations

import json
import os
import random
import time
from typing import Any
from urllib.parse import urlencode

import requests

TIMEOUT = (10, 30)
MAX_RETRIES = 5

session = requests.Session()
session.headers.update(
    {
        "User-Agent": (
            "Mozilla/5.0 (Macintosh; Intel Mac OS X 10_15_7) "
            "AppleWebKit/537.36 (KHTML, like Gecko) "
            "Chrome/126.0.0.0 Safari/537.36"
        ),
        "Accept-Language": "en-US,en;q=0.9",
        "X-Requested-With": "XMLHttpRequest",
    }
)


def build_proxiesapi_url(target_url: str) -> str:
    api_key = os.getenv("PROXIESAPI_KEY")
    if not api_key:
        return target_url

    qs = urlencode({"api_key": api_key, "url": target_url})
    return f"https://api.proxiesapi.com/?{qs}"


def fetch(url: str) -> requests.Response:
    final_url = build_proxiesapi_url(url)
    last_error = None

    for attempt in range(1, MAX_RETRIES + 1):
        try:
            response = session.get(final_url, timeout=TIMEOUT)
            if response.status_code in (429, 500, 502, 503, 504):
                raise requests.HTTPError(f"retryable status {response.status_code}")
            response.raise_for_status()
            return response
        except Exception as exc:  # noqa: BLE001
            last_error = exc
            if attempt == MAX_RETRIES:
                break
            sleep_s = min(20, 2 ** (attempt - 1)) + random.random()
            print(f"retry {attempt}/{MAX_RETRIES} after {exc} -> {sleep_s:.1f}s")
            time.sleep(sleep_s)

    raise RuntimeError(f"failed to fetch {url}: {last_error}")
If PROXIESAPI_KEY is not set, the code fetches GitHub directly. That is useful for one-off tests. As soon as you schedule this across many repositories, ProxiesAPI becomes the safer default.
Step 2: Discover the contributors data path from HTML
from bs4 import BeautifulSoup


def get_contributors_data_path(owner: str, repo: str) -> str:
    url = f"https://github.com/{owner}/{repo}/graphs/contributors"
    html = fetch(url).text
    soup = BeautifulSoup(html, "lxml")

    for script in soup.select('script[data-target="react-app.embeddedData"]'):
        raw = script.string or script.get_text()
        if not raw:
            continue
        payload = json.loads(raw)
        graph_path = payload.get("payload", {}).get("graphDataPath")
        if graph_path:
            return f"https://github.com{graph_path}"

    raise RuntimeError("contributors graphDataPath not found")
This is more reliable than guessing selectors for a chart that hydrates client-side.
Step 3: Download contributors and commit activity JSON
def get_contributors(owner: str, repo: str) -> list[dict[str, Any]]:
    data_url = get_contributors_data_path(owner, repo)
    response = fetch(data_url)
    return response.json()


def get_commit_activity(owner: str, repo: str) -> list[dict[str, Any]]:
    url = f"https://github.com/{owner}/{repo}/graphs/commit-activity-data"
    response = fetch(url)
    return response.json()
At the time of writing, the commit activity endpoint returns rows like:
{"total": 84, "week": 1755388800, "days": [3, 20, 16, 7, 9, 22, 7]}
Each row is one week:
week: Unix timestamp for the start of the weektotal: total commits that weekdays: commits per day from Sunday through Saturday
Step 4: Normalize the contributors dataset
GitHub's contributors graph payload is detailed. For most dashboards, you only need:
- contributor login
- total commits
- current week additions/deletions
- week-by-week history
from datetime import datetime, timezone


def normalize_contributors(rows: list[dict[str, Any]]) -> list[dict[str, Any]]:
    out: list[dict[str, Any]] = []

    for row in rows:
        author = row.get("author") or {}
        weeks = row.get("weeks") or []
        total_commits = sum((w.get("c") or 0) for w in weeks)
        active_weeks = sum(1 for w in weeks if (w.get("c") or 0) > 0)
        last_active_ts = max((w.get("w") or 0) for w in weeks) if weeks else 0

        out.append(
            {
                "login": author.get("login"),
                "profile_url": author.get("path"),
                "avatar_url": author.get("avatar"),
                "total_commits": total_commits,
                "active_weeks": active_weeks,
                "last_active_at": (
                    datetime.fromtimestamp(last_active_ts, tz=timezone.utc).isoformat()
                    if last_active_ts
                    else None
                ),
            }
        )

    return sorted(out, key=lambda r: r["total_commits"], reverse=True)
If you need full historical charts later, keep the raw JSON alongside this summary export.
Step 5: Normalize weekly commit activity
def normalize_commit_activity(rows: list[dict[str, Any]]) -> list[dict[str, Any]]:
    out: list[dict[str, Any]] = []

    for row in rows:
        week_ts = row["week"]
        days = row["days"]
        out.append(
            {
                "week_start": datetime.fromtimestamp(week_ts, tz=timezone.utc).date().isoformat(),
                "weekly_total": row["total"],
                "sunday": days[0],
                "monday": days[1],
                "tuesday": days[2],
                "wednesday": days[3],
                "thursday": days[4],
                "friday": days[5],
                "saturday": days[6],
            }
        )

    return out
That gives you a clean time series you can chart directly or feed into a warehouse job.
Step 6: Export CSV and build a quick health summary
import pandas as pd


def export_dataset(owner: str, repo: str) -> None:
    contributors_raw = get_contributors(owner, repo)
    commits_raw = get_commit_activity(owner, repo)

    contributors = normalize_contributors(contributors_raw)
    commits = normalize_commit_activity(commits_raw)

    contributors_df = pd.DataFrame(contributors)
    commits_df = pd.DataFrame(commits)

    contributors_df.to_csv(f"{owner}_{repo}_contributors.csv", index=False)
    commits_df.to_csv(f"{owner}_{repo}_commit_activity.csv", index=False)

    recent = commits_df.tail(8)
    avg_recent_commits = float(recent["weekly_total"].mean()) if not recent.empty else 0.0

    summary = {
        "owner": owner,
        "repo": repo,
        "contributors_count": len(contributors_df),
        "top_contributor": contributors_df.iloc[0]["login"] if not contributors_df.empty else None,
        "avg_weekly_commits_last_8_weeks": round(avg_recent_commits, 2),
    }
    print(summary)


if __name__ == "__main__":
    export_dataset("python", "cpython")
Example output:
{'owner': 'python', 'repo': 'cpython', 'contributors_count': 100,
 'top_contributor': '...', 'avg_weekly_commits_last_8_weeks': 140.5}
Why this works well
This approach is lightweight because it avoids browser automation entirely:
- the contributors page reveals the JSON source in embedded HTML
- the commit activity chart is already available as JSON
- the exports are easy to test locally with one repo before scaling
That is exactly when you should skip Playwright and keep the stack boring.
Practical notes
- Public GitHub pages still rate-limit aggressive collection. Use retries and polite spacing.
- Store the raw JSON if you care about future parser changes.
- Do not assume the contributors payload shape is permanent. Keep the normalization code small and easy to adjust.
- If you need private repositories or richer issue and PR data, move to the official GitHub API instead of forcing scraping to do everything.
Where ProxiesAPI fits
For a single public repo, direct requests are often enough.
ProxiesAPI helps once you start:
- scraping many repositories in a batch
- running scheduled health snapshots every day
- enriching repo links discovered elsewhere
- retrying around transient 429, 503, and edge timeouts
The win is not magic. It is operational stability with less network plumbing in your scraper.
If your goal is a simple engineering-health dataset, this GitHub flow gets you there without OAuth, browser automation, or a heavyweight pipeline on day one.
Public GitHub pages are easy to test manually, but scheduled scraping across many repositories benefits from retries, pacing, and a proxy layer you can switch on without rewriting the scraper.