
Scrape Numbeo Traffic and Commute Index by City with Python
Numbeo is one of the quickest ways to assemble city-level urban data without negotiating a vendor contract.
If your project needs comparable transport signals across cities, the traffic pages are especially useful because they expose:
- traffic index
- average travel time
- inefficiency index
- average travel distance
- commute mode shares like walking, car, bus, and metro
That is enough to build:
- relocation and livability dashboards
- commute benchmarking datasets
- city intelligence newsletters
- transport UX comparisons
In this guide we will scrape Numbeo traffic pages for multiple cities and export one flat CSV.
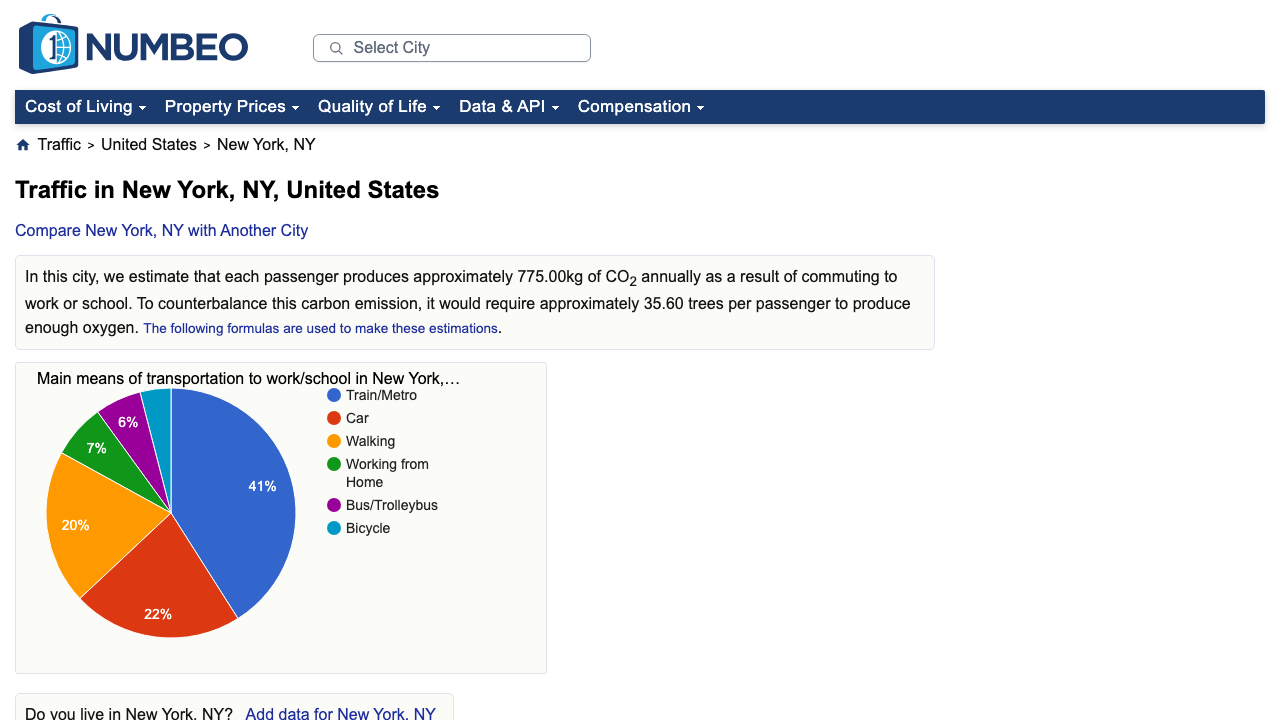
Numbeo pages are lightweight, but broad multi-city collection still benefits from retries, pacing, and a proxy-backed fetch layer you can switch on without rewriting the parser.
What we are scraping
Numbeo traffic pages follow a predictable URL pattern:
https://www.numbeo.com/traffic/in/New-Yorkhttps://www.numbeo.com/traffic/in/Londonhttps://www.numbeo.com/traffic/in/Singapore
On those pages, the useful blocks are:
- the top
table_indicessummary table - the mode-share table below it
- the small averages table with distance and travel time
In testing, these pages returned complete server-rendered HTML to a normal browser-like request, so we can stay with a regular HTTP client and skip headless automation for extraction.
Quick sanity check:
curl -L -A "Mozilla/5.0" -s "https://www.numbeo.com/traffic/in/New-York" | rg -n "Traffic Index|Average Travel Time|Working from Home"
If those markers appear in the HTML, you can parse directly.
Setup
python3 -m venv .venv
source .venv/bin/activate
pip install requests beautifulsoup4 lxml pandas
Step 1: Fetch HTML with retries and optional ProxiesAPI support
from __future__ import annotations

import os
import random
import time
from urllib.parse import quote

import requests

HEADERS = {
    "User-Agent": (
        "Mozilla/5.0 (Macintosh; Intel Mac OS X 10_15_7) "
        "AppleWebKit/537.36 (KHTML, like Gecko) "
        "Chrome/127.0.0.0 Safari/537.36"
    ),
    "Accept-Language": "en-US,en;q=0.9",
}
TIMEOUT = (10, 30)
MAX_ATTEMPTS = 4
session = requests.Session()


def build_fetch_url(target_url: str) -> str:
    api_key = os.getenv("PROXIESAPI_KEY")
    if not api_key:
        return target_url
    return (
        "http://api.proxiesapi.com/?key="
        + quote(api_key, safe="")
        + "&url="
        + quote(target_url, safe="")
    )


def fetch_html(url: str) -> str:
    final_url = build_fetch_url(url)
    last_error = None

    for attempt in range(1, MAX_ATTEMPTS + 1):
        try:
            resp = session.get(final_url, headers=HEADERS, timeout=TIMEOUT)
            if resp.status_code in {429, 500, 502, 503, 504}:
                raise RuntimeError(f"retryable status {resp.status_code}")
            resp.raise_for_status()
            return resp.text
        except Exception as exc:
            last_error = exc
            if attempt == MAX_ATTEMPTS:
                break
            time.sleep(min(12, 2 ** attempt) + random.random())

    raise RuntimeError(f"failed to fetch {url}: {last_error}")
This is enough for Numbeo because the page is HTML-first and the data blocks are visible without running JavaScript.
Step 2: Parse the summary metrics, mode shares, and averages
import re
from bs4 import BeautifulSoup


def clean_text(text: str | None) -> str | None:
    if not text:
        return None
    return re.sub(r"\s+", " ", text).strip() or None


def parse_num(text: str | None) -> float | None:
    if not text:
        return None
    cleaned = re.sub(r"[^0-9.,-]", "", text).replace(",", "")
    try:
        return float(cleaned)
    except ValueError:
        return None


def table_rows(table) -> list[list[str]]:
    rows = []
    for tr in table.select("tr"):
        cells = [clean_text(cell.get_text(" ", strip=True)) for cell in tr.select("th,td")]
        cells = [cell for cell in cells if cell]
        if cells:
            rows.append(cells)
    return rows


def parse_city_page(html: str, city: str) -> dict:
    soup = BeautifulSoup(html, "lxml")
    tables = soup.select("table")

    summary_rows = table_rows(soup.select_one("table.table_indices"))
    mode_rows = table_rows(tables[2])
    average_rows = table_rows(tables[3])

    summary = {row[0].rstrip(":"): parse_num(row[1]) for row in summary_rows[1:] if len(row) >= 2}
    mode_share = {row[0]: parse_num(row[1]) for row in mode_rows if len(row) >= 2}
    averages = {row[0]: parse_num(row[1]) for row in average_rows if len(row) >= 2}

    return {
        "city": city,
        "traffic_index": summary.get("Traffic Index"),
        "time_index_minutes": summary.get("Time Index (in minutes)"),
        "time_exp_index": summary.get("Time Exp. Index"),
        "inefficiency_index": summary.get("Inefficiency Index"),
        "co2_emission_index": summary.get("CO2 Emission Index"),
        "working_from_home_pct": mode_share.get("Working from Home"),
        "walking_pct": mode_share.get("Walking"),
        "car_pct": mode_share.get("Car"),
        "bicycle_pct": mode_share.get("Bicycle"),
        "bus_tram_pct": mode_share.get("Bus/Trolleybus"),
        "train_metro_pct": mode_share.get("Train/Metro"),
        "average_distance_km": averages.get("Average Distance"),
        "average_travel_time_min": averages.get("Average Travel Time"),
    }
Why parse by table position here?
Because Numbeo's traffic page structure is consistent:
- table 2 is the
table_indicessummary block - table 3 is modal split
- table 4 is average distance/time
You could search by headings, but the table order is already stable enough and simpler to maintain.
Step 3: Crawl a list of cities and write a CSV
import csv
from urllib.parse import quote

BASE = "https://www.numbeo.com/traffic/in"


def city_url(city_slug: str) -> str:
    return f"{BASE}/{quote(city_slug)}"


def scrape_city(city_slug: str) -> dict:
    html = fetch_html(city_url(city_slug))
    return parse_city_page(html, city_slug)


def write_csv(rows: list[dict], path: str = "numbeo_traffic_cities.csv") -> None:
    with open(path, "w", newline="", encoding="utf-8") as handle:
        writer = csv.DictWriter(handle, fieldnames=list(rows[0].keys()))
        writer.writeheader()
        writer.writerows(rows)


if __name__ == "__main__":
    cities = ["New-York", "London", "Singapore", "Amsterdam", "Toronto"]
    rows = [scrape_city(city) for city in cities]
    write_csv(rows)
    print("wrote", len(rows), "rows")
Typical output:
wrote 5 rows
That gives you one row per city, which is the right shape for comparison dashboards and ranking tables.
Step 4: Rank cities by commute pain
import pandas as pd


def worst_commutes(csv_path: str = "numbeo_traffic_cities.csv") -> pd.DataFrame:
    df = pd.read_csv(csv_path)
    ranked = df.sort_values(
        ["traffic_index", "average_travel_time_min"],
        ascending=[False, False],
    )
    return ranked[[
        "city",
        "traffic_index",
        "average_travel_time_min",
        "average_distance_km",
        "car_pct",
        "train_metro_pct",
    ]]


print(worst_commutes().head(10))
This is where the scraped output becomes useful:
- compare dense transit cities vs car-first cities
- track commute changes over time
- feed urban dashboards and newsletter charts
Practical advice for Numbeo scraping
1. Treat it as a snapshot, not immutable truth
Numbeo reflects user-contributed data and rolling site updates. Add a scrape date if you plan to compare cities over time.
2. Validate that the main tables exist before parsing
If the page structure changes, you want a clear failure early rather than silently writing partial rows.
3. Keep the dataset long-lived, not the request session
Numbeo pages are light enough that you do not need elaborate browser sessions. Store more snapshots, not more browser state.
4. Add ProxiesAPI when the crawl expands
For five cities, direct fetching is usually enough. For hundreds of cities on a recurring job, a proxy-backed fetch layer can reduce transient failures and make retries less painful.
A compact comparison table
Once you have the CSV, a table like this becomes trivial to generate:
| Metric | Why it matters |
|---|---|
| Traffic Index | Broad congestion signal |
| Time Index (minutes) | How long commutes actually take |
| Inefficiency Index | Captures wasted time relative to distance |
| Average Distance | Separates long commutes from slow ones |
| Mode Share | Useful context for transit vs car-heavy cities |
That mix is much more useful than scraping a single headline number.
Where ProxiesAPI fits
This tutorial does not require a browser or a heavy anti-bot stack.
That is exactly why ProxiesAPI is useful as an optional layer instead of a dependency:
- keep the parser identical
- route through a managed network layer when scale requires it
- avoid rewriting your extraction code later
The integration point is build_fetch_url(). Switch it on only when your crawl volume justifies it.
FAQ
Do I need Playwright for Numbeo traffic pages?
No, not for the extraction flow shown here. In testing, the traffic tables were present in the raw HTML returned by a normal browser-like request.
Why not scrape the global ranking page instead?
You can, but city pages include richer context like modal split and average travel distance. That makes them better for a reusable dataset.
What if CO2 Emission Index is missing?
Some pages omit it. That is why the parser treats it as optional and writes None when absent.
Summary
If your goal is to scrape Numbeo traffic and commute index data by city, the reliable approach is:
- fetch the traffic city page as raw HTML
- parse the summary table, mode-share table, and averages table
- flatten one row per city
- export a dated CSV for comparison and trend analysis
That gives you a compact urban dataset without bringing browser automation into a problem that does not need it.
Numbeo pages are lightweight, but broad multi-city collection still benefits from retries, pacing, and a proxy-backed fetch layer you can switch on without rewriting the parser.