Scrape Yahoo Finance Analyst Ratings and Price Targets with Python
Yahoo Finance’s Analysis tab is useful because it compresses a lot of analyst sentiment into a few tables:
- recommendation trend
- mean / low / high price targets
- analyst count
- revenue and EPS estimate tables
That is exactly the kind of page that becomes more useful once you turn it into a dataset.
In this guide, we’ll scrape the rendered Analysis page for a ticker like AAPL, extract the analyst tables, normalize them, and export a CSV you can reuse in your own research workflow.
The important detail is that Yahoo Finance is not a plain “fetch once with requests” target anymore. In this environment, direct HTTP requests to Yahoo’s finance endpoints were rate-limited, so the stable pattern is:
- render the page in a real browser
- wait for the visible tables
- parse those tables with
pandas.read_html()
Yahoo Finance is one of those targets that works until it doesn’t. When your local script starts hitting unstable responses or throttling, ProxiesAPI gives you a cleaner network path without forcing you to rewrite the parser.
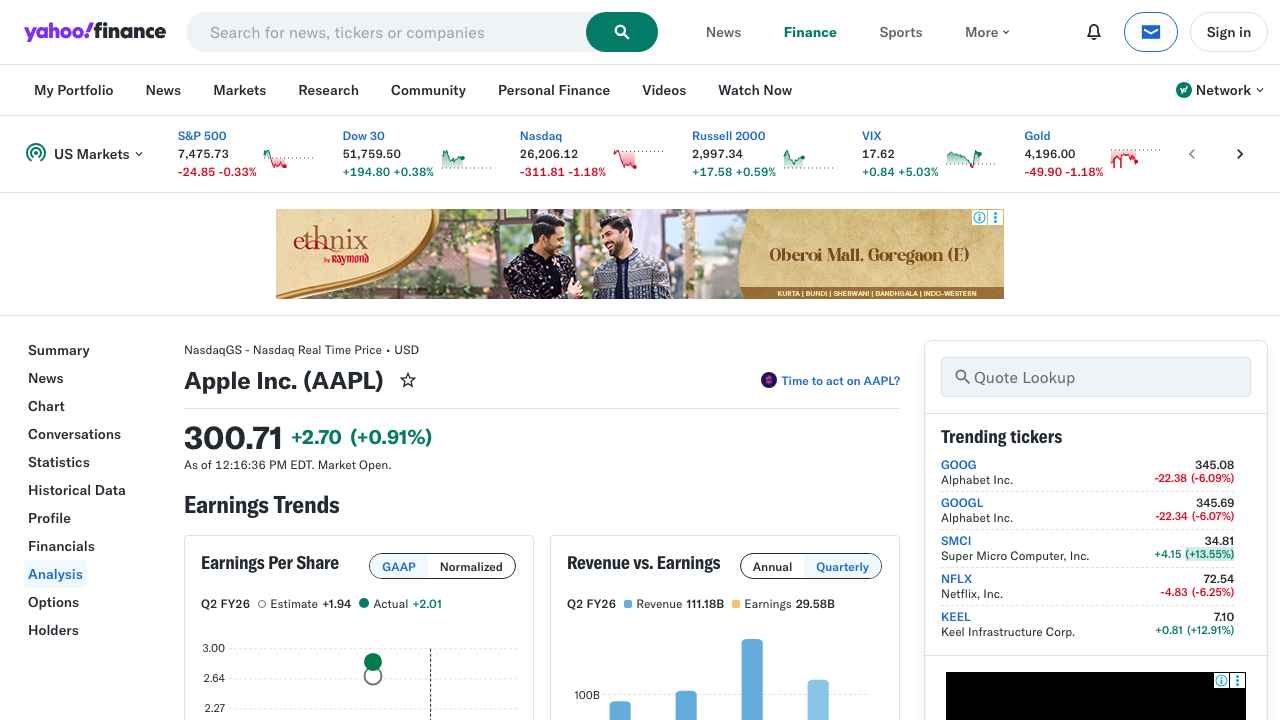
The page we want
For any ticker, the analysis page lives at:
https://finance.yahoo.com/quote/AAPL/analysis/
Try another symbol by swapping AAPL:
MSFTNVDATSLA
The page usually contains several rendered tables. The ones we care about most are:
- Recommendation Trend
- Recommendation Rating
- Price Target
The visible HTML changes more often than the URL pattern, so the safest approach is to anchor on the rendered tables, not Yahoo’s styling classes.
Install the stack
python3 -m venv .venv
source .venv/bin/activate
pip install selenium pandas beautifulsoup4 lxml html5lib
Why this stack:
seleniumrenders the pagepandas.read_html()extracts tables fastBeautifulSoupis handy for heading metadatalxml/html5libhelp with HTML parsing edge cases
Step 1: Render the page in headless Chrome
We’ll open the Analysis tab in a real browser, wait for tables to appear, then capture the final HTML.
from __future__ import annotations

import os
from selenium import webdriver
from selenium.webdriver.chrome.options import Options
from selenium.webdriver.common.by import By
from selenium.webdriver.support.ui import WebDriverWait
from selenium.webdriver.support import expected_conditions as EC


def build_driver() -> webdriver.Chrome:
    options = Options()
    options.add_argument("--headless=new")
    options.add_argument("--window-size=1440,2200")
    options.add_argument(
        "--user-agent=Mozilla/5.0 (Macintosh; Intel Mac OS X 10_15_7) "
        "AppleWebKit/537.36 (KHTML, like Gecko) Chrome/125.0 Safari/537.36"
    )

    # Optional: route Chrome through ProxiesAPI when you need a more stable IP layer.
    proxy_url = os.getenv("PROXIESAPI_PROXY_URL")
    if proxy_url:
        options.add_argument(f"--proxy-server={proxy_url}")

    return webdriver.Chrome(options=options)


def fetch_rendered_html(symbol: str) -> str:
    url = f"https://finance.yahoo.com/quote/{symbol}/analysis/"
    driver = build_driver()
    try:
        driver.get(url)
        WebDriverWait(driver, 35).until(
            EC.presence_of_element_located((By.CSS_SELECTOR, "table"))
        )
        return driver.page_source
    finally:
        driver.quit()
Why wait on table instead of a text string? Because the rendered tables are the real target. If the tables never appear, the data is not ready.
Step 2: Parse the visible tables
Once the HTML is rendered, pandas.read_html() does most of the heavy lifting.
from io import StringIO
import pandas as pd


def extract_tables(html: str) -> list[pd.DataFrame]:
    return pd.read_html(StringIO(html))
The Analysis page typically returns multiple tables, so the next job is selecting the ones we actually want.
Step 3: Find the analyst tables we care about
This approach is more robust than hard-coding “table 2” or “table 5”.
def pick_price_target_table(tables: list[pd.DataFrame]) -> pd.DataFrame:
    for df in tables:
        first_col = df.iloc[:, 0].astype(str).str.strip().tolist()
        if "Current Price" in first_col and "Mean Target" in first_col:
            out = df.copy()
            out.columns = ["metric", "value"]
            return out
    raise ValueError("Price target table not found")


def pick_recommendation_rating_table(tables: list[pd.DataFrame]) -> pd.DataFrame:
    for df in tables:
        first_col = df.iloc[:, 0].astype(str).str.strip().tolist()
        if "Mean Rating" in first_col and "No. of Analysts" in first_col:
            out = df.copy()
            out.columns = ["metric", "value"]
            return out
    raise ValueError("Recommendation rating table not found")


def pick_recommendation_trend_table(tables: list[pd.DataFrame]) -> pd.DataFrame:
    expected = {"Strong Buy", "Buy", "Hold", "Sell", "Strong Sell"}
    for df in tables:
        cols = {str(col).strip() for col in df.columns}
        if expected.issubset(cols):
            return df.copy()
    raise ValueError("Recommendation trend table not found")
This selection logic is grounded in the actual labels Yahoo shows on the Analysis page, which makes it easier to survive layout tweaks.
Step 4: Extract ticker metadata from the heading
The tables tell us the analyst story, but we usually also want:
- symbol
- company name
We can pull that from the page heading.
import re
from bs4 import BeautifulSoup


def extract_metadata(html: str, fallback_symbol: str) -> dict:
    soup = BeautifulSoup(html, "lxml")
    title_text = ""

    h1 = soup.select_one("h1")
    if h1:
        title_text = h1.get_text(" ", strip=True)

    # Example heading pattern:
    # "Apple Inc. (AAPL)"
    m = re.search(r"^(.*?)\s*\(([A-Z.\-]+)\)$", title_text)
    if m:
        return {
            "company_name": m.group(1).strip(),
            "symbol": m.group(2).strip(),
        }

    return {
        "company_name": title_text or None,
        "symbol": fallback_symbol,
    }
Step 5: Normalize everything into one flat dataset
This turns the page into rows you can append every day.
def table_to_dict(df: pd.DataFrame) -> dict:
    return {
        str(row["metric"]).strip(): str(row["value"]).strip()
        for _, row in df.iterrows()
    }


def normalize(symbol: str, html: str) -> tuple[pd.DataFrame, pd.DataFrame]:
    tables = extract_tables(html)

    price_targets = pick_price_target_table(tables)
    rating_table = pick_recommendation_rating_table(tables)
    trend_table = pick_recommendation_trend_table(tables)
    metadata = extract_metadata(html, symbol)

    price_map = table_to_dict(price_targets)
    rating_map = table_to_dict(rating_table)

    summary = pd.DataFrame(
        [
            {
                "symbol": metadata["symbol"],
                "company_name": metadata["company_name"],
                "current_price": price_map.get("Current Price"),
                "target_low": price_map.get("Low Target"),
                "target_mean": price_map.get("Mean Target"),
                "target_high": price_map.get("High Target"),
                "mean_rating": rating_map.get("Mean Rating"),
                "analyst_count": rating_map.get("No. of Analysts"),
            }
        ]
    )

    trend = trend_table.copy()
    trend["symbol"] = metadata["symbol"]
    trend["company_name"] = metadata["company_name"]

    return summary, trend
The result is two useful outputs:
- a one-row summary for each ticker
- a recommendation trend table that keeps the original buy/hold/sell split
Step 6: Export to CSV
def scrape_yahoo_analysis(symbol: str) -> tuple[pd.DataFrame, pd.DataFrame]:
    html = fetch_rendered_html(symbol)
    return normalize(symbol, html)


if __name__ == "__main__":
    symbol = "AAPL"
    summary_df, trend_df = scrape_yahoo_analysis(symbol)

    print(summary_df.to_string(index=False))
    print()
    print(trend_df.head().to_string(index=False))

    summary_df.to_csv(f"{symbol.lower()}_analyst_summary.csv", index=False)
    trend_df.to_csv(f"{symbol.lower()}_recommendation_trend.csv", index=False)

    print("saved:", f"{symbol.lower()}_analyst_summary.csv")
    print("saved:", f"{symbol.lower()}_recommendation_trend.csv")
Typical output shape:
symbol company_name current_price target_low target_mean target_high mean_rating analyst_count
  AAPL   Apple Inc.        201.55     170.00      229.34      300.00        2.10            38
And for the trend table:
Period Strong Buy Buy Hold Sell Strong Sell symbol company_name
0m          14    21    3    0           0   AAPL   Apple Inc.
-1m         15    20    3    0           0   AAPL   Apple Inc.
-2m         15    19    4    0           0   AAPL   Apple Inc.
Batch multiple tickers
Once the logic works for one ticker, looping a watchlist is straightforward.
WATCHLIST = ["AAPL", "MSFT", "NVDA", "TSLA", "AMZN"]

all_summaries = []
all_trends = []

for symbol in WATCHLIST:
    try:
        summary_df, trend_df = scrape_yahoo_analysis(symbol)
        all_summaries.append(summary_df)
        all_trends.append(trend_df)
    except Exception as exc:
        print("failed:", symbol, exc)

if all_summaries:
    pd.concat(all_summaries, ignore_index=True).to_csv("watchlist_analyst_summary.csv", index=False)

if all_trends:
    pd.concat(all_trends, ignore_index=True).to_csv("watchlist_recommendation_trend.csv", index=False)
That gives you a compact analyst snapshot across your full list.
What can break?
Yahoo Finance is a moving target, so expect three common failure modes:
| Failure | Likely cause | Fix |
|---|---|---|
| no tables found | page did not finish rendering | wait longer, check login/cookie banners |
| wrong table selected | labels changed slightly | loosen the table-matching rules |
| intermittent access failures | throttling or network instability | use calmer pacing and route through ProxiesAPI |
The good news is that the structure of the visible tables tends to be more stable than one-off CSS selectors.
Where ProxiesAPI fits
The valuable split here is:
- Selenium + pandas handle rendering and parsing
- ProxiesAPI improves the network path when Yahoo starts getting inconsistent
If you already have a proxy endpoint from ProxiesAPI, set:
export PROXIESAPI_PROXY_URL="http://USER:PASS@proxy.proxiesapi.com:PORT"
Then the browser layer uses it automatically through:
proxy_url = os.getenv("PROXIESAPI_PROXY_URL")
if proxy_url:
    options.add_argument(f"--proxy-server={proxy_url}")
That is the cleanest upgrade path: keep the scraper logic, improve the connection layer.
Final thoughts
Yahoo Finance analyst pages are a good example of a page that looks simple in the browser but behaves like a semi-dynamic app when you try to scrape it at scale.
The pattern that holds up is:
- render the page
- extract tables by labels, not styles
- normalize into flat CSVs
- add a better proxy layer only when the network starts failing
That gets you a reusable analyst dataset without over-engineering the parser on day one.
Yahoo Finance is one of those targets that works until it doesn’t. When your local script starts hitting unstable responses or throttling, ProxiesAPI gives you a cleaner network path without forcing you to rewrite the parser.